Where the money was spent
In 2012, expenditure for Non Blood Humanitarian Services was $376.2 million, with 76% of expenditure invested in delivery of Red Cross programs. Expenditure rose from 2011 in direct response to community need and in line with increases in government funding.
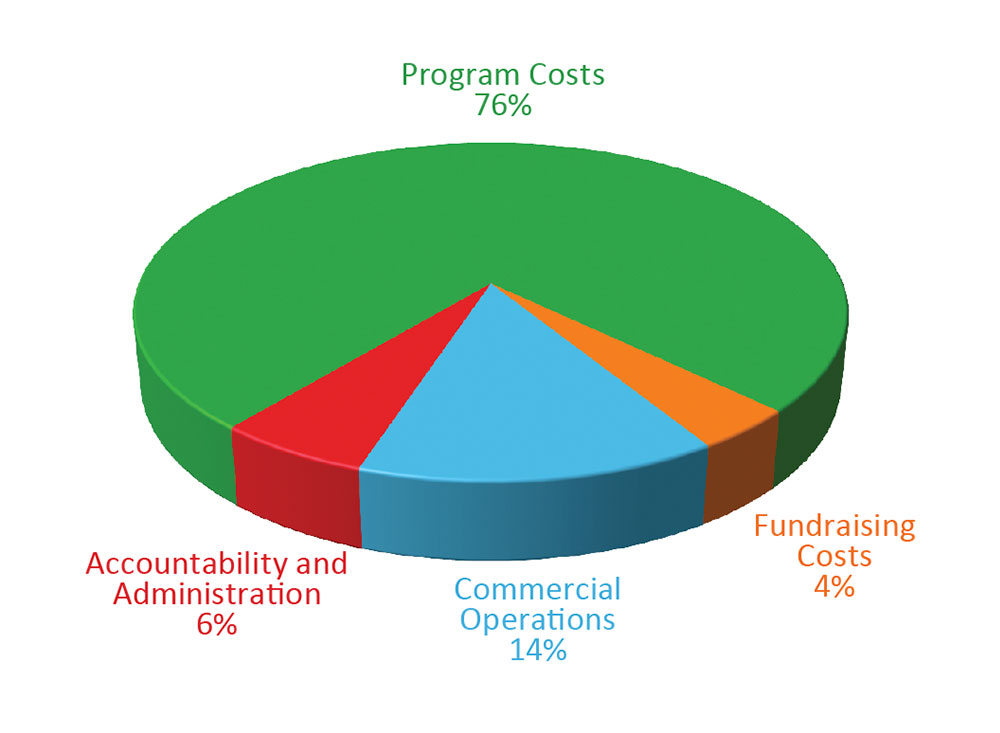
Fundraising costs amounted to $15.9 million (4% of total expenditure). This includes all costs associated with fundraising income, administering Emergency Appeals and soliciting non-cash gifts that, in accordance with organisational policy, are not recognised in the accounts.
Cost of administration was 6% of total expenditure in 2012 (7% in 2011). Administration includes essential support costs critical to the everyday running of the organisation.
Commercial costs relate to the sale of goods, workforce training and employment services to job seekers, including those with disabilities or a social disadvantage.
Our everyday work
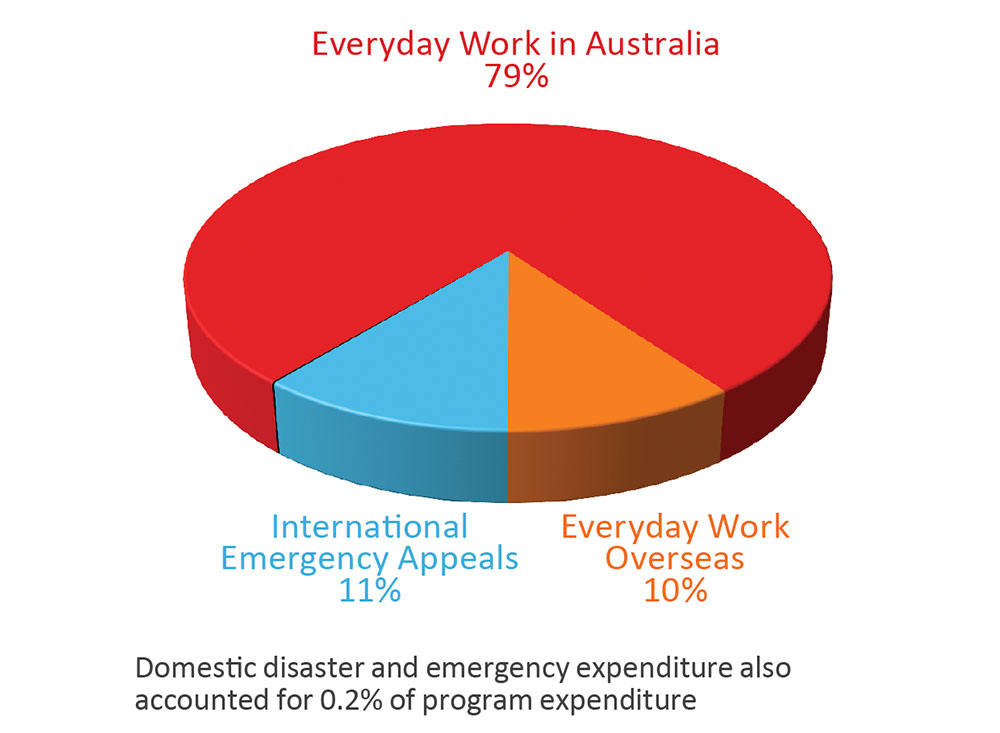
89% of program expenditure was spent on our everyday humanitarian work, which aims to address disadvantage across Australia and overseas.
$225.3 million was spent here in Australia, accounting for 79.2% of program expenditure. This primarily went towards our everyday work helping people in the community.
There were no major disasters in 2012, resulting in lower donation levels overall, but recovery work continued in response to disasters that occurred in previous years. Disaster and emergency expenditure accounted for 11.1% of program expenditure this year. The majority of international expenditure was attending to disasters, such as the 2011 Earthquake and Tsunami in Japan. A total of $0.5 million was disbursed to the Victorian Flood Appeal Trust account and was the only domestic disaster expenditure.
Where the program money was spent
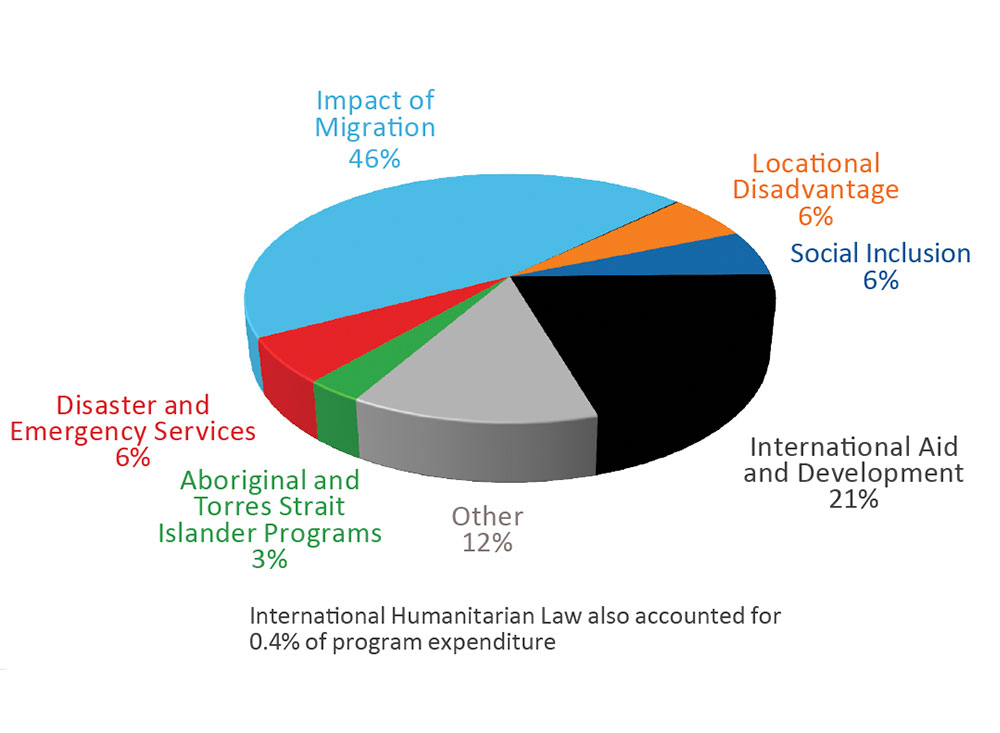
Program expenditure (excluding Blood Service) was $283.8 million, an increase of 47% from 2011. Red Cross humanitarian work is defined according to seven key priority areas. The majority of expenditure was for a range of health and welfare services designed to assist people impacted by migration. This expansion was a direct result of changes to Government policy and accounted for 45.6% of program expenditure, up from 19% in 2011.
The Social Inclusion priority area also increased due to a realignment of services and growth of homelessness programs. Expenditure increased for International Aid and Development activities funded by a partnership agreement with AusAID.
The Other category includes expenditure for programs that have been deemed critical to service provision in local communities, but don’t fall into one of the seven priority areas.
Let us know what you think.
We welcome your comments and suggestions. Contact the editorial team at publications@redcross.org.au