Overall net result shows a deficit of $8.7 million for the year, a product of $0.1 million deficit in Humanitarian Services and a $8.6 million deficit from the Blood Service. Total revenue (including Blood Service) was $967.1 million offset by costs of $975.8 million.
-
Community support for Red Cross has grown 8% in 2015, however this growth has largely been driven through increased community support via emergency appeals. Community support for everyday work has increased marginally ($0.4 million) over 2014. Over $41.8 million of this was generated by 130,000 regular givers giving over $30 per month (an increase of $4.5 million on last year).
-
Fundraising costs amount to 7% of total expenditure (excluding Blood Service). The decrease in costs against 2014 reflect the change in the fundraising mix year on year to more cost effective fundraising.
-
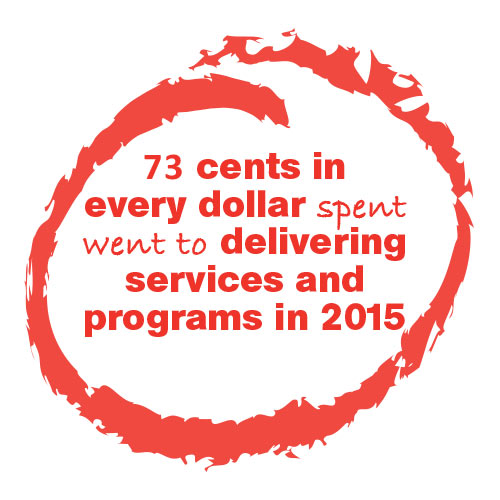
Income and expenditure for Humanitarian Services contracted this year due to reduced government funding of migration support programs. Over $298 million was spent delivering programs to support vulnerable people and communities in Australia and further afield.
-
Administration costs are 10% of total expenditure (excluding Blood Service) and include costs critical to the effective running of the Society such as information technology, finance, human resources and occupancy costs; in previous years some of these costs were allocated within the specific programs they supported.
-
Retail activities delivered $4.4 million after costs - the strongest result in several years - to support Red Cross work in communities, despite seven fewer stores. Retail’s ‘back to basics’ plan is also ensuring a re-focus on customers, and greater engagement with local communities.
Five years at a glance
|
2015 |
2014 |
2013 |
2012 |
2011 |
|
|
$'000 |
$'000 |
$'000 |
$'000 |
$'000 |
|
|
Financial Results ($’000) |
|||||
|
Blood Service 1 |
559,806 |
581,800 |
574,587 |
578,461 |
567,471 |
|
Government Grants 2 |
242,363 |
362,846 |
288,804 |
217,663 |
115,086 |
|
Community Support - for everyday work |
85,453 |
85,025 |
75,579 |
56,729 |
53,677 |
|
Community Support - for emergency appeals |
21,714 |
14,399 |
20,186 |
4,102 |
55,586 |
|
Commercial Operations |
8,566 |
11,613 |
33,498 |
34,336 |
34,766 |
|
Retail activities |
21,527 |
20,956 |
- |
- |
- |
|
Government Grants for Commercial Operations |
10,815 |
12,984 |
15,590 |
17,074 |
14,094 |
|
Other Income 3 |
16,877 |
19,060 |
15,546 |
46,567 |
24,913 |
|
Total income |
967,122 |
1,108,683 |
1,023,790 |
954,932 |
865,593 |
|
Blood Service |
568,441 |
555,897 |
561,749 |
539,317 |
465,798 |
|
Domestic programs |
249,933 |
366,296 |
314,261 |
223,754 |
121,981 |
|
International programs |
31,780 |
38,243 |
34,344 |
28,620 |
17,716 |
|
Emergency Appeals 4 |
17,139 |
8,289 |
14,630 |
31,439 |
53,149 |
|
Commercial operations 5 |
20,674 |
24,774 |
46,052 |
47,753 |
49,988 |
|
Retail activities |
17,108 |
17,934 |
- |
- |
- |
|
Fundraising Costs 6 |
26,426 |
27,043 |
15,864 |
15,965 |
14,880 |
|
Marketing |
4,271 |
4,166 |
3,353 |
5,981 |
6,356 |
|
Administration 7 |
40,091 |
38,003 |
19,912 |
22,694 |
19,482 |
|
Total expenditure |
975,864 |
1,080,645 |
1,010,165 |
915,523 |
749,350 |
|
Surplus/(Deficit) |
(8,742) |
28,038 |
13,625 |
39,409 |
116,243 |
|
Cost of Fundraising including Emergency Appeals |
25% |
27% |
17% |
26% |
14% |
|
Cost of Fundraising excluding Emergency Appeals |
31% |
32% |
21% |
28% |
28% |
|
Cost of Administration |
10% |
7% |
4% |
6% |
7% |
|
Program Investment Ratio without Emergencies |
69% |
77% |
78% |
67% |
49% |
|
1 Blood Service is fully funded by Australian Governments for domestic provision of blood products and services. Blood Service includes Capital Works of $32m in 2015, $53m in 2014, $52m in 2013 and $60m in 2012. 2 Government Grants excludes Blood Service and Commercial Operations (shown separately), but includes grants for International Federation Statutory Meetings. 3 Other includes investment income. 4 Emergency Appeals includes Domestic and International Appeals. 5Commercial Operations includes Red Cross College, Red Cross Disability Employment and Red Cross products. 6 Fundraising costs include costs for raising revenue and in-kind support from public, government and non-government grants. 7 Administration expenditure includes one-off costs of $5.8m relating to information technology upgrade and divestment of property. This also includes $12.6m of expenditure relating to internal costs which were classified under domestic programs & marketing during FY 2011, 2012 & 2013. |
|||||