ACFID compliance
Australian Red Cross is a signatory to the Australian Council for International Aid and Development (ACFID) Code of Conduct and is committed to full adherence to its requirements. The Code aims to improve international development outcomes and increase stakeholder trust by enhancing the transparency and accountability of signatory organisations.
The ACFID Code of Conduct offers a mechanism to address concerns relating to signatories' conduct. Complaints may be initiated by any member of the public and lodged with the ACFID Code of Conduct Committee at https://acfid.asn.au/content/complaints, or for further information on the ACFID Code please see ACFID website acfid.asn.au. No complaints were made against Australian Red Cross within this financial year.
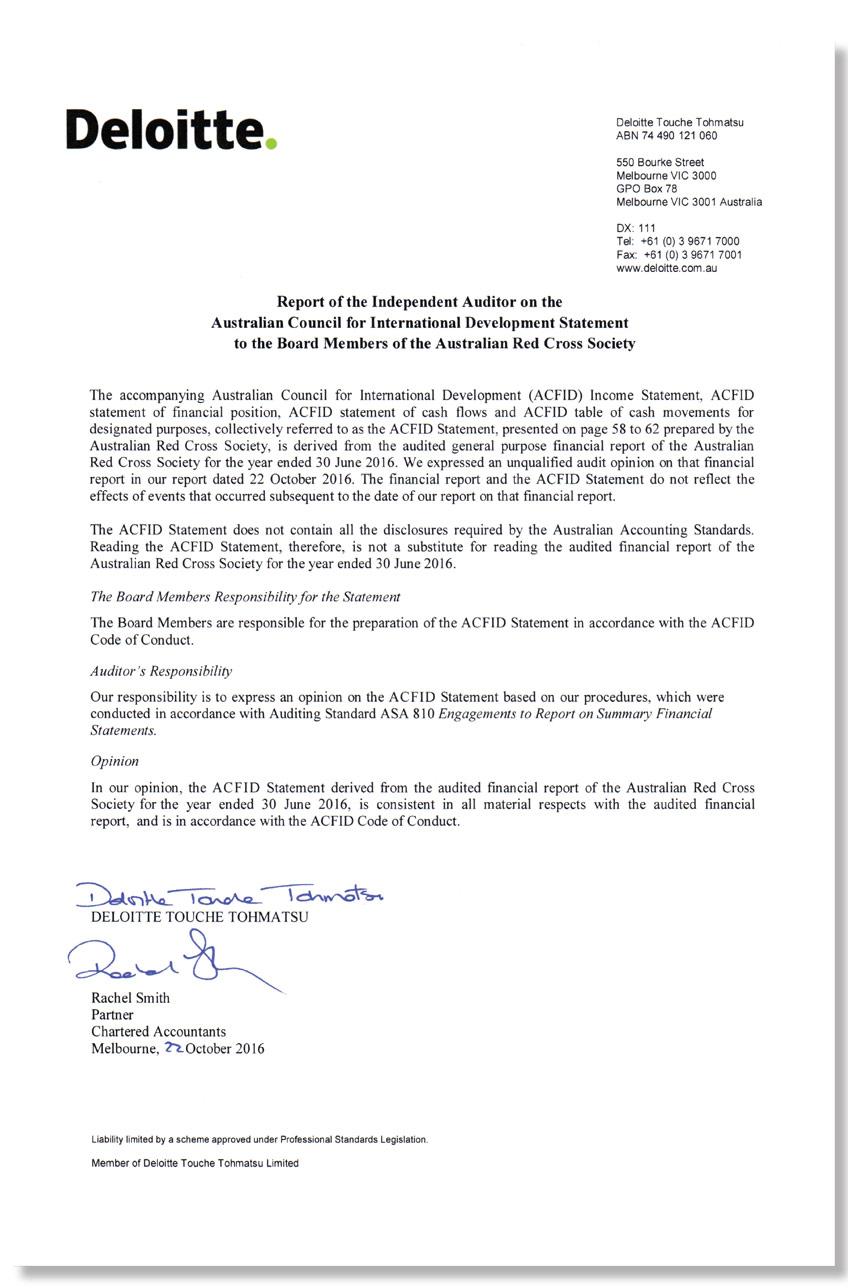
The financial statements below conform with the ACFID prescribed format and standards and should be read in conjunction with the other components of the ACFID financial statements, as well as the financial statements and accompanying notes on pages 6-42 of the full financial report, available at redcross.org.au/files/Financials_2016.pdf
Income statement
for the financial year ended 30 June 2016
| Humanitarian Services | Society | Humanitarian Services | Society | |
| 2016 | 2016 | 2015 | 2015 | |
| $'000 | $'000 | $'000 | $'000 | |
|
REVENUE |
||||
| Donations and gifts 1 | 76,901 | 76,901 | 93,123 | 93,123 |
| Legacies and bequests | 12,594 | 12,594 | 13,670 | 13,670 |
| Grants | ||||
| - Department of Foreign Affairs and Trade | 24,358 | 24,358 | 23,735 | 23,735 |
| - other Australian | 129,062 | 698,143 | 229,497 | 770,065 |
| - other overseas | 5,784 | 5,784 | 3,010 | 3,010 |
| Investment income | 3,384 | 11,125 | 4,076 | 12,093 |
| Other income 2 | 41,444 | 65,127 | 39,794 | 51,015 |
| Total revenue | 293,527 | 894,032 | 406,905 | 966,711 |
|
EXPENDITURE |
||||
| International aid and development programs expenditure | ||||
| - funds to international programs | 41,728 | 41,728 | 42,995 | 42,995 |
| - program support costs | 3,428 | 3,428 | 4,364 | 4,364 |
| - community education 3 | 1,561 | 1,561 | 1,465 | 1,465 |
| Domestic programs | ||||
| - Blood Service | - | 575,904 | - | 568,441 |
| - Migration support | 51,413 | 51,413 | 158,619 | 158,619 |
| - Social inclusion | 38,929 | 38,929 | 37,917 | 37,917 |
| - Locational disadvantage | 37,296 | 37,296 | 34,317 | 34,317 |
| - Disaster and emergency services | 10,186 | 10,186 | 10,759 | 10,759 |
| - Aboriginal & Torres Strait Islander programs | 7,700 | 7,700 | 8,660 | 8,660 |
| - Emergency appeals | 349 | 349 | 1,379 | 1,379 |
| - Other | 4,867 | 4,867 | 4,928 | 4,928 |
| Fundraising costs 4 | ||||
| - Public, government, multilateral and private | 24,204 | 24,204 | 26,425 | 26,425 |
| Retail and commercial activities | 37,122 | 37,122 | 38,006 | 38,006 |
| Accountability and administration5 | 38,725 | 38,725 | 37,178 | 37,178 |
| Total expenditure | 297,508 | 873,412 | 407,012 | 975,453 |
| (Deficiency)/excess of revenue over expenditure from continuing operations | (3,981) | 20,620 | (107) | (8,742) |
|
Figures for the 2015 financial year have been restated due to (i) grant funds returned being netted off to government grant income which were previously included under government grant income expenditure (ii) re-mapping of expenses related directly to programs which were previously included under administration. |
||||
Statement of financial position
as at 30 June 2016
|
Humanitarian Services |
Society |
Humanitarian Services |
Society |
|
|
2016 |
2016 |
2015 |
2015 |
|
|
$'000 |
$'000 |
$'000 |
$'000 |
|
|
ASSETS |
||||
|
Current assets |
||||
|
Cash and cash equivalents |
36,955 |
230,693 |
42,277 |
241,140 |
|
Trade and other receivables |
16,392 |
23,781 |
19,062 |
26,616 |
|
Inventories |
1,405 |
24,271 |
990 |
19,838 |
|
Other financial assets |
39,681 |
110,341 |
40,109 |
73,108 |
|
Other |
2,465 |
7,571 |
3,996 |
10,073 |
|
Total current assets |
96,898 |
396,657 |
106,434 |
370,775 |
|
Non-current assets |
||||
|
Property, plant and equipment |
67,371 |
375,810 |
72,778 |
388,613 |
|
Intangible assets |
17,687 |
47,758 |
20,179 |
41,499 |
|
Total non-current assets |
85,058 |
423,568 |
92,957 |
430,112 |
|
Total assets |
181,956 |
820,225 |
199,391 |
800,887 |
|
LIABILITIES |
||||
|
Current liabilities |
||||
|
Trade and other payables |
13,854 |
47,449 |
18,612 |
55,618 |
|
Borrowings |
- |
10,786 |
10,632 |
20,582 |
|
Provisions |
15,735 |
72,316 |
15,146 |
69,358 |
|
Other |
3,912 |
124,171 |
870 |
98,970 |
|
Total current liabilities |
33,501 |
254,722 |
45,260 |
244,528 |
|
Non-current liabilities |
||||
|
Borrowings |
- |
49,741 |
- |
60,523 |
|
Provisions |
4,519 |
17,813 |
5,206 |
17,553 |
|
Defined benefit superannuation plans |
65 |
3,346 |
65 |
1,698 |
|
Other |
- |
4,285 |
- |
3,360 |
|
Total non-current liabilities |
4,584 |
75,185 |
5,271 |
83,134 |
|
Total liabilities |
38,085 |
329,907 |
50,531 |
327,662 |
|
NET ASSETS |
143,871 |
490,318 |
148,860 |
473,225 |
|
Equity |
||||
|
Reserves |
1,313 |
120,836 |
2,321 |
111,202 |
|
Specific purpose funds |
40,056 |
40,056 |
51,958 |
51,958 |
|
Accumulated funds |
102,502 |
329,426 |
94,581 |
310,065 |
|
TOTAL EQUITY |
143,871 |
490,318 |
148,860 |
473,225 |
Statement of cash flows
for the financial year ended 30 June 2016
|
Humanitarian Services |
Society |
Humanitarian |
Society |
|
|
2016 |
2016 |
2015 |
2015 |
|
|
$’000 |
$'000 |
$’000 |
$’000 |
|
|
Cash flows from operating activities |
||||
|
Receipts from donors, government and other sources |
296,005 |
948,046 |
327,666 |
934,578 |
|
Payments to suppliers and employees |
(289,400) |
(840,752) |
(420,036) |
(976,711) |
|
Interest and other costs of finance paid |
(1,263) |
(6,552) |
(1,206) |
(7,247) |
|
Net cash provided by/(used in) operating activities |
5,342 |
100,742 |
(93,576) |
(49,380) |
|
Cash flows from investing activities |
||||
|
Payments for property, plant, equipment and intangibles |
(2,284) |
(62,021) |
(5,710) |
(53,434) |
|
Proceeds from disposal of property, plant and equipment |
159 |
450 |
237 |
444 |
|
Net payments for purchase of investment securities |
(575) |
(39,453) |
(22,753) |
(56,091) |
|
Dividends received |
737 |
1,780 |
1,044 |
1,044 |
|
Interest received |
1,931 |
8,629 |
2,554 |
10,627 |
|
Net cash used in investing activities |
(32) |
(90,615) |
(24,628) |
(97,410) |
|
Cash flows from financing activities |
||||
|
Proceeds from borrowings |
1,500 |
1,500 |
10,461 |
10,461 |
|
Repayment of borrowings |
(8,346) |
(18,292) |
(3,615) |
(12,809) |
|
Net cash (used in)/provided by financing activities |
(6,846) |
(16,792) |
6,846 |
(2,348) |
|
Net decrease in cash and cash equivalents |
(1,536) |
(6,665) |
(111,358) |
(149,138) |
|
Cash and cash equivalents at the beginning of the financial year |
38,491 |
237,354 |
149,974 |
386,579 |
|
Effects of exchange rate changes on the balance of cash held in foreign currencies |
- |
4 |
(125) |
(87) |
|
CASH AND CASH EQUIVALENTS AT THE END OF THE FINANCIAL YEAR |
36,955 |
230,693 |
38,491 |
237,354 |
Table of cash movements for designated purposes
for the financial year ended 30 June 2016
|
Cash available at beginning of year |
Cash raised during year |
Cash disbursed during year |
Cash transfer |
Cash available at end of year |
|
|
$'000 |
$'000 |
$'000 |
$'000 |
$’000 |
|
|
Designated purpose |
|||||
|
DFAT - Australian Aid Program |
10,878 |
26,091 |
(25,477) |
(1,027) |
10,465 |
|
Pakistan flood response appeal |
470 |
- |
(470) |
- |
- |
|
Humanitarian blood projects |
388 |
20 |
(136) |
(245) |
27 |
|
Typhoon Haiyan appeal |
2,974 |
1,446 |
(2,286) |
375 |
2,509 |
|
Syria appeal |
142 |
1,389 |
(1,174) |
38 |
395 |
|
Ebola appeal |
124 |
294 |
(111) |
(155) |
151 |
|
Nepal earthquake appeal |
7,688 |
1,036 |
(4,656) |
1,378 |
5,447 |
|
Cyclone Pam (Vanuatu) appeal |
3,802 |
64 |
(1,824) |
314 |
2,356 |
|
Tropical Cyclone Winston 2016 appeal |
- |
4,477 |
(1,944) |
(938) |
1,595 |
|
Total cash for designated purposes |
26,466 |
34,817 |
(38,078) |
(260) |
22,945 |
|
Total cash for other non-designated purposes |
210,888 |
925,588 |
(928,988) |
260 |
207,748 |
|
TOTAL |
237,354 |
960,405 |
(967,066) |
- |
230,693 |
|
Appeal funds raised in any one year are likely to be responsibly used over several years, as recovery work can be short, medium and long-term. |
|||||
Statement of changes in equity
for the financial year ended 30 June 2016
|
Humanitarian Services |
Blood Service |
|||||||
|
Accumulated funds |
Specific purpose funds |
Investment revaluation reserve |
Accumulated funds |
Special reserve |
Capital reserve |
Investment revaluation reserve |
Society |
|
|
$'000 |
$'000 |
$'000 |
$'000 |
$'000 |
$'000 |
$'000 |
$'000 |
|
|
Year ended 30 June 2015 |
||||||||
|
Balance as at 1 July 2014 |
99,131 |
47,515 |
3,215 |
204,834 |
57,973 |
64,867 |
- |
477,535 |
|
Deficit for the year |
(107) |
- |
- |
(8,635) |
- |
- |
- |
(8,742) |
|
Other comprehensive surplus/(deficit) for the year |
- |
- |
(894) |
5,664 |
- |
- |
(338) |
4,432 |
|
Transfers to/(from) specific purpose funds |
(4,443) |
4,443 |
- |
- |
- |
- |
- |
- |
|
Transfers to/(from) other reserves |
- |
- |
- |
13,621 |
723 |
(14,344) |
- |
- |
|
Balance as at 30 June 2015 |
94,581 |
51,958 |
2,321 |
215,484 |
58,696 |
50,523 |
(338) |
473,225 |
|
Year ended 30 June 2016 |
||||||||
|
Net (deficit)/surplus for the year |
(3,981) |
- |
- |
24,601 |
- |
- |
- |
20,620 |
|
Other comprehensive deficit for the year |
- |
- |
(1,008) |
(1,281) |
- |
- |
(1,238) |
(3,527) |
|
Transfers to/(from) specific purpose funds |
11,902 |
(11,902) |
- |
- |
- |
- |
- |
- |
|
Transfers to/(from) other reserves |
- |
- |
- |
(11,880) |
6,816 |
5,064 |
- |
- |
|
Balance as at 30 June 2016 |
102,502 |
40,056 |
1,313 |
226,924 |
65,512 |
55,587 |
(1,576) |
490,318 |


