Where the money was spent (Humanitarian Services)
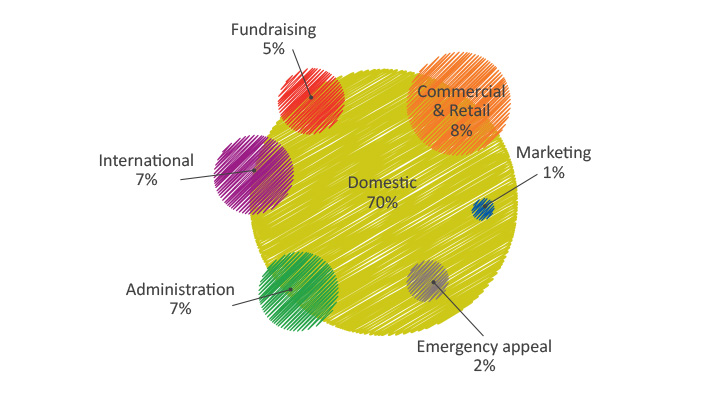
Expenditure on Humanitarian Services increased 17% to $524.7 million, comparable with the 17% growth in income over the same period. $412.8 million was spent delivering programs supporting vulnerable people in Australia and further afield, which means 79 cents in every dollar spent went to delivering services and programs.
Fundraising costs represented 5% of total expenditure (4% in 2013). These costs include all expenditure associated with fundraising income, administering emergency appeals and soliciting and managing pro-bono and non-cash gifts that, in accordance with organisational policy, are not recognised in the financial accounts. These costs also include for the first time costs from sale of tickets for art unions and events as well as investment in future years’ income.
In order to secure fundraising income in future years, the Board invested $5.8 million in Regular Giving and Bequests (both areas collectively provide around 60% of the Society’s donation income) and supporter servicing. Our cost of fundraising was 27%; excluding income from the Syrian Crisis and Typhoon Haiyan Appeals, it was 32%.
Administration costs are 7% of total expenditure (up from 4% in 2013), and include costs critical to the efficient and effective running of the Society such as Human Resources, IT, Finance and occupancy costs. Previous to the 2014 accounts some costs now included were allocated to the specific programs they supported. One-off costs of $5.6 million were incurred in relation to Australian Red Cross Centenary celebrations and International Federation Statutory Meetings (the latter offset by government funding).
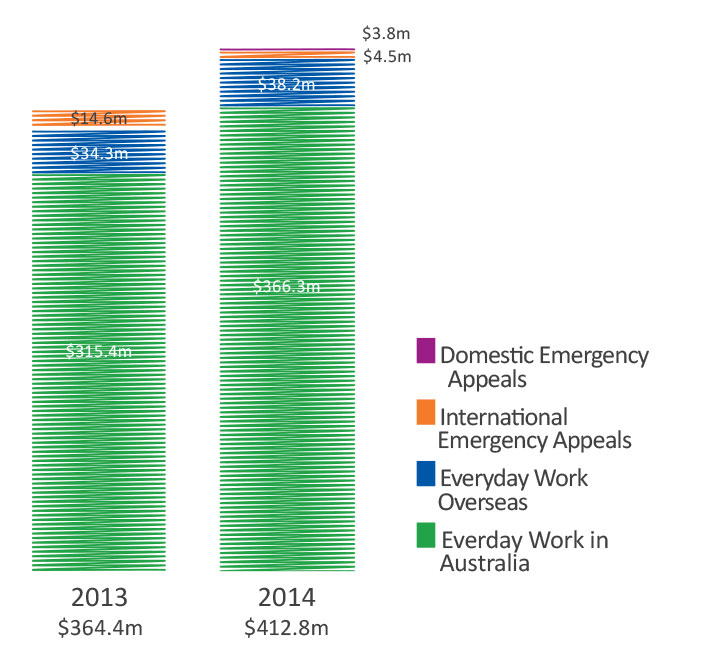
Our work in Australia and overseas
In 2014 we spent $412.8 million on our everyday Humanitarian Services, emergencies and disasters. 98% of this expenditure was on our everyday programs, working alongside disadvantaged and vulnerable communities throughout Australia and overseas. Domestic expenditure grew to $366.3 million in 2014, representing 89% of our ongoing everyday program spend (excluding Disaster Appeals).
Expenditure on disasters and emergencies fluctuates each year according to their number and severity. Bushfires again accounted for most of our domestic emergency and recovery work, particularly the extensive fires in the Blue Mountains of NSW, despite not launching a specific appeal for this. The humanitarian crises in Syria and the devastating effects of Typhoon Haiyan were the focus of our emergency responses internationally.
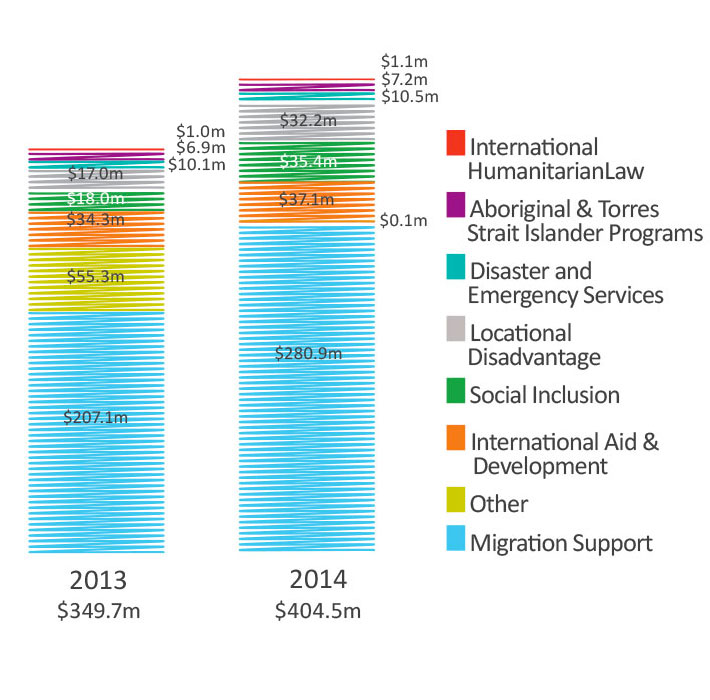
Spend by Program (excluding disaster appeals)
Our program investment increased $54.8 million this year in direct response to community need and increases in funding from the government. Our work in Migration Support expanded significantly with the support of government; as did our Social Inclusion priority area as a result of increased government grants.
Each funding opportunity is assessed through our internal review processes to determine whether programs are aligned with community needs, have undergone thorough risk assessments and align with Red Cross fundamental principles, strategic direction and established ways of working.
Our program activities within Humanitarian Services are defined according to our priority areas and all new programs must establish a link to our priority areas to be considered for funding.
Program spend on everyday work by priority area
Let us know what you think
Any feedback or complaints about Red Cross or its work can be made at redcross.org.au or by calling 1800 811 700. Red Cross invites any feedback you may have regarding the Year in Review 2013/2014. Contact the editorial team at publications@redcross.org.au